
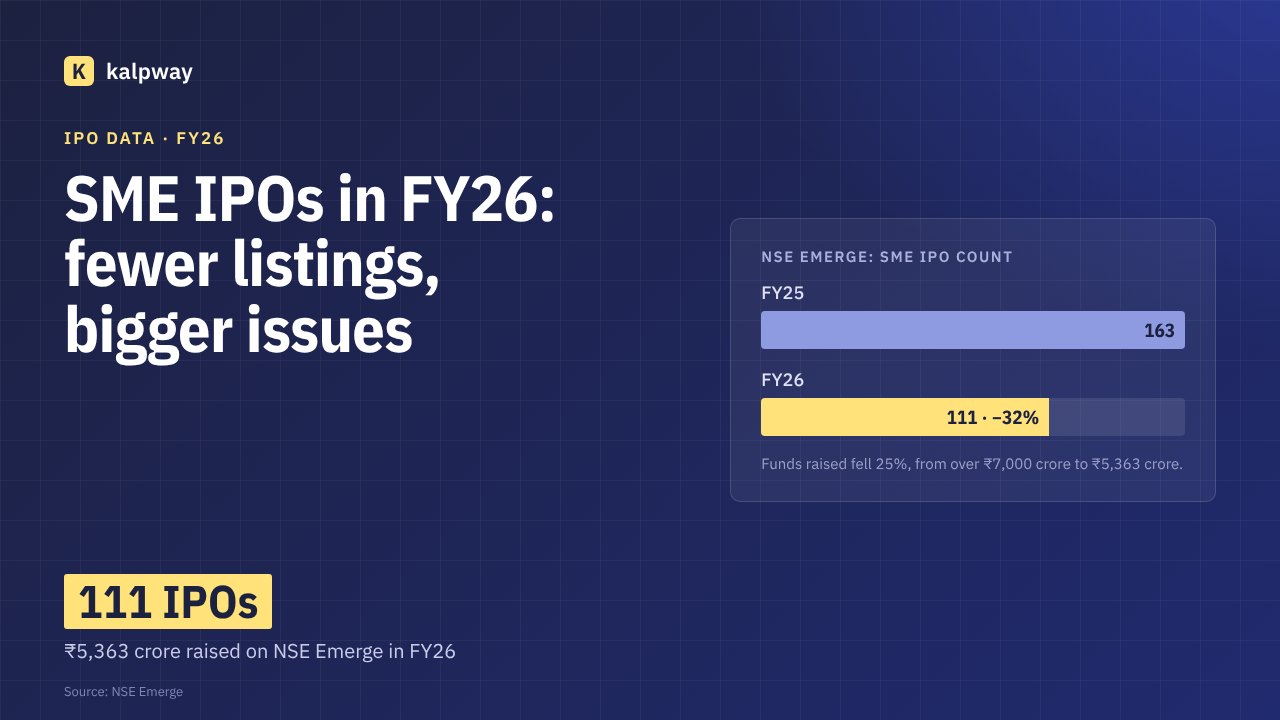
SME IPO activity cooled in FY26 (April 2025 to March 2026). On NSE Emerge, 111 SME IPOs raised ₹5,363 crore, according to NSE — a 32% fall in the number of issues and a 25% fall in money raised compared with FY25. Counting both SME platforms, Grant Thornton Bharat puts the year at 258 SME IPOs and about ₹12,030 crore. Fewer companies came to market, but the ones that did raised more on average.
How many SME IPOs were there in FY26?
The answer depends on which exchange you count. The table below brings together the main published figures and what each one covers.
| Source | Scope | Period | SME IPOs | Amount raised |
|---|---|---|---|---|
| NSE (via Kotak Neo / ANI) | NSE Emerge only | FY26, full year | 111 | ₹5,363 crore |
| NSE Market Pulse, March 2026 | NSE Emerge only | FY26, April–February | 105 | ₹5,121 crore |
| Grant Thornton Bharat | NSE Emerge and BSE SME | FY26, full year | 258 | About ₹12,030 crore |
| Economic Survey 2025-26 | All SME IPOs | FY26, April–December | — | ₹9,635 crore (vs ₹7,453 crore a year earlier) |
Why don’t the SME IPO numbers match?
Three things explain most of the gap:
- Exchange coverage. NSE’s own figures cover NSE Emerge only. Grant Thornton’s figures also include BSE SME, which is why its count is more than twice NSE’s.
- Period. The Economic Survey covers only April to December 2025, and NSE’s March report runs only to February.
- Counting method. Some trackers count an IPO in the month it opens for bidding, others in the month it lists. Issues near the end of March can fall into different years.
The Economic Survey’s April–December figure even shows SME fundraising rising year on year, while NSE Emerge’s full-year funds fell. Both can be true: they cover different exchanges and different months. When you cite an SME IPO figure, say which exchange and which period it covers.
Did SME IPOs get bigger?
On NSE Emerge, yes. Dividing funds raised by the number of issues gives an average of about ₹48 crore per SME IPO in FY26, compared with about ₹43 crore in FY25 (Kalpway calculation from NSE figures; FY25 funds were reported as “over ₹7,000 crore”, so the FY25 average is a minimum). NSE’s March 2026 market report also noted a steady increase in average SME IPO size.
What happened alongside the slowdown?
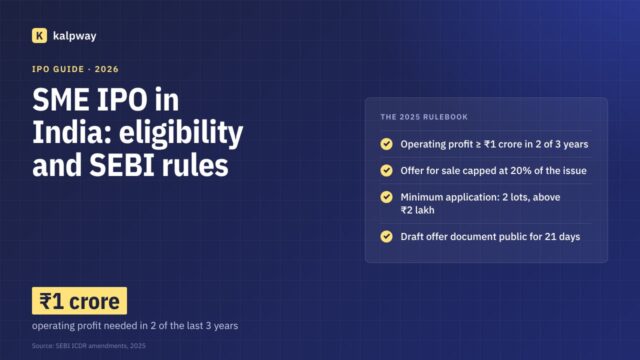
FY26 was the first full year under SEBI’s tighter SME IPO framework, notified in March 2025. It introduced a profitability test (operating profit of at least ₹1 crore in two of the last three years), capped offer-for-sale at 20% of the issue and raised the minimum application to more than ₹2 lakh. These rules exclude smaller and loss-making issuers by design, which is consistent with fewer but larger issues. Other factors, such as market conditions, also affect issuance, so the data alone does not show how much of the change the new rules caused.
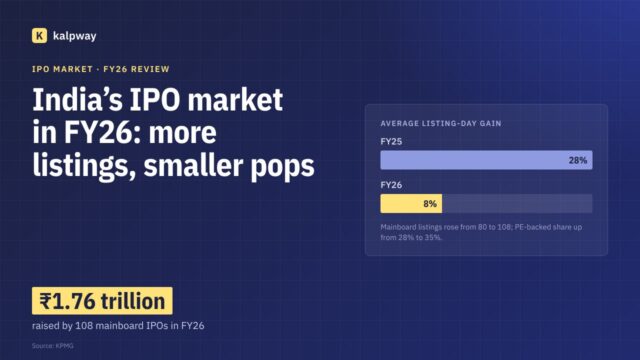
The mainboard moved the other way. KPMG counted 108 mainboard IPOs raising ₹1.76 trillion in FY26. See our FY26 IPO market review for details.
What does this mean for SMEs planning to list?
- The profit and cash-flow tests mean an SME IPO is now a route for established, profitable businesses rather than early-stage ones. See the full eligibility rules.
- Larger average issues suggest investors and lead managers are concentrating on bigger SMEs.
- Exchange choice matters for both visibility and data: NSE Emerge and BSE SME publish separate statistics.
Methodology
Kalpway compiled the figures above from the sources listed below as of 8 October 2026. Where a source reports a rounded or minimum value (“over ₹7,000 crore”, “about ₹12,030 crore”), we show it the same way. Average issue sizes are Kalpway’s calculations and are labelled as such. The Kalpway IPO Tracker records each issue individually with its source.